List of micronations by HDI

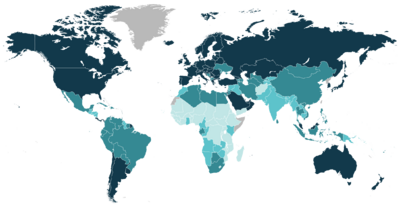
- Very high (≥ 0.800)
- High (0.700–0.799)
- Medium (0.550–0.699)
- Low (≤ 0.549)
- Data unavailable

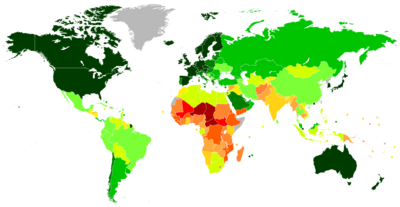
- ≥ 0.900
- 0.850–0.899
- 0.800–0.849
- 0.750–0.799
- 0.700–0.749
- 0.650–0.699
- 0.600–0.649
- 0.550–0.599
- 0.500–0.549
- 0.450–0.499
- 0.400–0.449
- ≤ 0.399
- Data unavailable
The list of micronations by human development index is a compilation of as many micronations as possible politically inspired by the list of 189 widely recognized sovereign states compiled by the United Nations Development Program in the Human Development Report. The index considers the health, education and income in a given country to provide a measure of human development which is comparable between countries and over time.[1][2]
The Micronational HDI was first published in 2022, inspired by the UN-made HDI list first published in 1990 with the goal of being a more comprehensive measure of human development than purely economic measures such as gross domestic product, whose measurement is extremely difficult for unrecognized microstates and referred to as micronations. The index incorporates three dimensions of human development: a long and healthy life, knowledge, and decent living standards. Various indicators are used to quantify how countries perform on each dimension. The indicators used in the UN 2020 report were life expectancy at birth; expected years of schooling for children; mean years of schooling for adults; and gross national income per capita. The indicators are used to create a health index, an education index and an income index, each with a value between 0 and 1. The geometric mean of the three indices—that is, the cube root of the product of the indices—is the human development index. A value above 0.800 is classified as very high, between 0.700 and 0.799 as high, 0.550 to 0.699 as medium, and below 0.550 as low.[1][3][4]
The data used to calculate HDI comes mostly from official data collected by the governments of the micronations represented in the list. Rarely, when one of the indicators is missing, cross-country regression models can be used. Due to improved data and methodology updates, HDI values are not necessarily comparable across human development reports; instead, each report may recalculates the HDI for some previous years.[4][5]
The HDI is the most widely used indicator of human development and changed how people view the concept, thus why it was adopted in a micronational scale.[6][7] However, several aspects of the index have received criticism. Some scholars have criticized how the factors are weighed, in particular how an additional year of life expectancy is valued differently between countries;[7][8] and the limited factors it considers, noting the omission of factors such as the levels of distributional and gender inequality.[9][10] Others have criticized the perceived oversimplification of using a single number per country.[11]
Micronations
This list is incomplete, you can help MicroWiki by expanding it. |
The Human Development Report aims to include all politically active micronations. The Human Development Index, however, is not calculated by any particular entity or organization, and its data are provided by the governments of the mentioned countries, therefore not necessarily reflecting an established and unquestionable reality.
Countries ranked from 0.800 to 1.000 in the year 2022 are considered to be of very high HDI, ranked 0.700 to 0.799 are considered to be of high HDI, ranked 0.550 to 0.699 are considered to be of medium HDI, and ranked 0.000 to 0.549 are considered to be of low HDI.
| Rank | Micronation | HDI | ||
|---|---|---|---|---|
| 2017 to 2022 data (2022 report)[2] | Change over 5 years (2014)[12] | 2017 to 2023 data (2023 report)[2] | Average annual growth (2017–2023)[12] | |
| 1 | 0.994 | ▲ 0.16% | ||
| 2 | ▲ | 0.976 | ▲ 0.39% | |
| 3 | ▲ | 0.963 | ▲ 0.16% | |
| 4 | ▲ | 0.956 | ▲ 0.03% | |
| 5 | ▲ | 0.949 | ▲ 0.16% | |
| 6 | ▼ | 0.948 | ▲ 0.16% | |
| 7 | ▲ | 0.948 | ▲ 0.20% | |
| 8 | ▼ | 0.943 | ▲ 0.16% | |
| 9 | ▼ | 0.942 | ▲ 0.16% | |
| 10 | ▲ | 0.936 | ▲ 0.16% | |
| 11 | 0.933 | ▲ 0.16% | ||
| 12 | ▲ | 0.930 | ▲ 0.16% | |
| 13 | ▲ | 0.929 | ▲ 0.54% | |
| 14 | ▼ | 0.929 | ▲ 0.54% | |
| 15 | ▲ | 0.950 | ▲ 0.80% | |
| 16 | ▼ | 0.929 | ▲ 0.54% | |
| 17 | ▼ | 0.926 | ▲ 0.54% | |
| 18 | 0.924 | ▲ 0.16% | ||
| 19 | ▼ | 0.924 | ▲ 0.16% | |
| 20 | ▼ | 0.919 | ▲ 0.16% | |
| 21 | ▼ | 0.917 | ▲ 0.16% | |
| 22 | ▼ | 0.916 | ▲ 0.16% | |
| 23 | ▼ | 0.911 | ▲ 0.20% | |
| 24 | ▼ | 0.909 | ▲ 0.16% | |
| 25 | ▼ | 0.905 | ▲ 0.16% | |
| 26 | ▼ | 0.900 | ▲ 0.20% | |
| 27 | ▼ | 0.900 | ▲ 0.20% | |
| 28 | ▼ | Zakinesia | 0.900 | ▲ 0.12% |
| 29 | ▲ | 0.896 | ▲ 0.25% | |
| 30 | ▼ | 0.893 | ▲ 0.16% | |
| 31 | ▼ | 0.890 | ▲ 0.16% | |
| 32 | 0.890 | ▲ 0.16% | ||
| 33 | ▼ | 0.886 | ||
| 34 | ▲ | 0.884 | ▲ 0.16% | |
| 35 | 0.880 | ▲ 0.16% | ||
| 36 | ▲ | 0.877 | ▲ 0.16% | |
| 37 | ▼ | 0.874 | ▲ 0.16% | |
| 38 | ▲ | 0.873 | ▲ 0.16% | |
| 39 | 0.870 | ▲ 0.16% | ||
| 40 | ▼ | 0.856 | ▲ 0.20% | |
| 41 | ▼ | 0.855 | ▲ 0.16% | |
| 42 | ▼ | 0.854 | ▲ 0.16% | |
| 43 | ▼ | 0.850 | ▲ 0.16% | |
| 44 | ▼ | 0.815 | ▲ 0.16% | |
| 45 | ▼ | 0.812 | ▲ 0.16% | |
| 46 | ▲ | 0.809 | ▲ 0.16% | |
| 47 | ▲ | 0.801 | ▲ 0.16% | |
| 48 | ▲ | 0.790 | ▲ 0.16% | |
| 49 | ▼ | 0.787 | ||
| 50 | ▼ | 0.786 | ▲ 0.16% | |
| 51 | ▲ | 0.785 | ▲ 0.11% | |
| 52 | ▼ | 0.781 | ▲ 0.16% | |
| 53 | ▼ | 0.767 | ▼ 100% | |
| 54 | ▼ | 0.763 | ▲ 0.16% | |
| 55 | ▼ | 0.763 | ▲ 0.16% | |
| 56 | ▼ | 0.750 | ▲ 0.16% | |
| 57 | ▲ | 0.735 | ▲ 2.04% | |
| 58 | ▼ | 0.731 | ||
| 59 | ▼ | 0.719 | ▲ 0.16% | |
| 60 | ▲ | 0.713 | ▲ 0.48% | |
| 61 | ▼ | 0.700 | ▲ 0.16% | |
| 62 | ▼ | 0.700 | ▲ 0.16% | |
| 63 | 0.700 | ▲ 0.16% | ||
| 64 | ▼ | 0.698 | ▼ 1.00% | |
| 65 | ▼ | 0.674 | ▲ 0.16% | |
| 66 | 0.632 | ▲ 0.16% | ||
| 67 | 0.574 | ▲ 0.16% | ||
| 68 | 0.567 | ▲ 0.16% | ||
| 69 | Republic of Orchidland | 0.562 | ||
| 70 | ▲ | 0.546 | ▲ 0.16% | |
| 71 | 0.500 | ▲ 0.16% | ||
| 72 | ▲ | 0.482 | ▲51.57% | |
Notes
- ↑ HDI of the Romanian county of Ilfov, where Snagov lies enclaved.
- ↑ HDI of the Canadian territory of Nunavut, the closest inhabited region to Hans Island, Hansland's claimed territory.
- ↑ HDI of the US state of Ohio, the state where Slavtria sits enclaved.
- ↑ The calculation was made using the GNI (PPP) of the US state of Texas and the Canadian province of Ontario, in which Baustralia is enclave. An average value was calculated from the economic data of these two regions. The expected years of schooling value used for the calculation is identical for the United States and Canada, while the mean years of schooling value was estimated based on the mean years of schooling according to the average age of Baustralian government members, which is around 18 years old. The value of life expectancy at birth was calculated as a rounded average (80) from the values for the United States (78.9) and Canada (82.3).
- ↑ The calculation was made using the Gross National Income (PPP), the expected years of schooling and life expectancy at birth for the Czech Republic, within which the Gymnasium State is enclaved. The value of the mean years of schooling (13 years), however, are estimates based on the mean years of schooling according to the average age of Gymnazist government members, which is around 18 years old.
See also
References
- ↑ 1.0 1.1 "Human Development Index (HDI) | Human Development Reports". hdr.undp.org. United Nations Development Programme. Archived from the original on 28 January 2017. Retrieved 15 December 2020.
- ↑ 2.0 2.1 2.2 Human Development Report 2020 The Next Frontier: Human Development and the Anthropocene. United Nations Development Programme. 15 December 2020. pp. 343–346. ISBN 978-9-211-26442-5. https://hdr.undp.org/system/files/documents//hdr2020pdf.pdf.
- ↑ Human Development Report 1990. United Nations Development Programme. 1 May 1990. pp. iii,iv,5, 9, 12. ISBN 0-1950-6481-X. http://hdr.undp.org/sites/default/files/reports/219/hdr_1990_en_complete_nostats.pdf.
- ↑ 4.0 4.1 "Human Development Report 2019 – Technical notes" (PDF). hdr.undp.org. United Nations Development Programme. pp. 2–4. Archived from the original (PDF) on 6 June 2021. Retrieved 15 December 2020.
- ↑ "Human Development Report 2020: Reader's Guide". hdr.undp.org. United Nations Development Programme. Archived from the original on 16 April 2021. Retrieved 15 December 2020.
- ↑ Ivanova, I.; Arcelus, F. J.; Srinivasan, G. (February 1999). "An Assessment of the Measurement Properties of the Human Development Index". Social Indicators Research. 46 (2): 157–179. Archived from the original on 6 June 2021. Retrieved 6 June 2021.
- ↑ 7.0 7.1 Sanderson, Warren; Scherbov, Sergei; Simone, Ghislandi (November 8, 2018). "The best country to live in might not be Norway after all". Quartz. Archived from the original on 23 January 2021. Retrieved 6 June 2021.
- ↑ Ravallion, Martin (2012-11-01). "Troubling tradeoffs in the Human Development Index". Journal of Development Economics. 99 (2): 201–209. Archived from the original on 12 November 2020. Retrieved 6 June 2021.
- ↑ Hicks, Douglas A. (1997-08-01). "The inequality-adjusted human development index: A constructive proposal". World Development. 25 (8): 1283–1298. Archived from the original on 10 June 2021. Retrieved 10 June 2021.
- ↑ Sharma, Shalendra D. (1997-02-01). "Making the Human Development Index (HDI) gender-sensitive". Gender & Development. 5 (1): 60–61. Archived from the original on 10 June 2021. Retrieved 10 June 2021.
- ↑ Castles, Ian (1998). "The Mismeasure of Nations: A Review Essay". Population and Development Review. 24 (4): 834–836. Archived from the original on 14 March 2021. Retrieved 6 June 2021.
- ↑ 12.0 12.1 Human Development Report 2020 The Next Frontier: Human Development and the Anthropocene. United Nations Development Programme. 15 December 2020. pp. 347–350. ISBN 978-9-211-26442-5. http://hdr.undp.org/sites/default/files/hdr2020.pdf.
